Oh hey, it’s been almost two years since my last update. Chalk it up to a busy life and a national lack of interest that resulted in less to talk about. The data I used to create my Indiana COVID-19 dashboard is no longer updated, so the dashboard is also no longer updated. I’ll leave it up for historical reference.
By the end of the third year of the pandemic, we’ve still not managed to keep people from dying of COVID-19 in Indiana. July 2023 was consistently at or near zero, but the daily deaths have been rising since. We’ve had, on average, about four per day in the last 2–3 months. But the state no longer feels the need to track that data.
Daily COVID-19 deaths in Indiana on a logarithmic scale
Still, our death toll has been far lower than in years past.
Daily COVID-19 deaths in Indiana compared year-to-year.
The same can’t be said for hospitalizations. When the state stopped taking a daily census on May 24 of this year, we had consistently been higher in 2023 than at the same time in 2022.
Daily COVID-19 hospital census in Indiana compared year-to-year.
But I guess COVID is over now. Or at least we’re pretending like it is. Just this morning, my wife and one of our kids tested positive. It’s the 1,375th day of March 2020.
Welcome to the new year, where we’re still dealing with COVID-19. The stats are a little muddy, both because of the holidays throwing a wrench into the reporting and also because I’m seeing some things I don’t quite expect. More on that below.
The recent past
In my last update just before Christmas, I noted that we had reached a peak in cases and hospitalizations. Possibly deaths as well, although that remained unclear. The cases and hospitalizations continued to slowly decline over the next few days, until beginning to rise again Christmas weekend.
Current state
Last month, I wrote “With vaccines available, we should see hospitalization and death rates far below [winter 2020–1]. On the other hand, indoor masking is nearly non-existent and the Omicron variant presents a rather significant unknown.” Omicron is no longer an unknown.
Cases
As Micah Pollak predicted, Indiana is seeing record levels of new cases. His “optimistic” (my word) scenario had 7,800 new cases today. His “pessimistic” scenario had us at 8,200 ten days ago. The pessimistic scenario was close: the 7-day moving average of new cases crossed 8,200 on January 3. As of yesterday’s update, the average is 13,935—79% higher than the optimistic scenario.
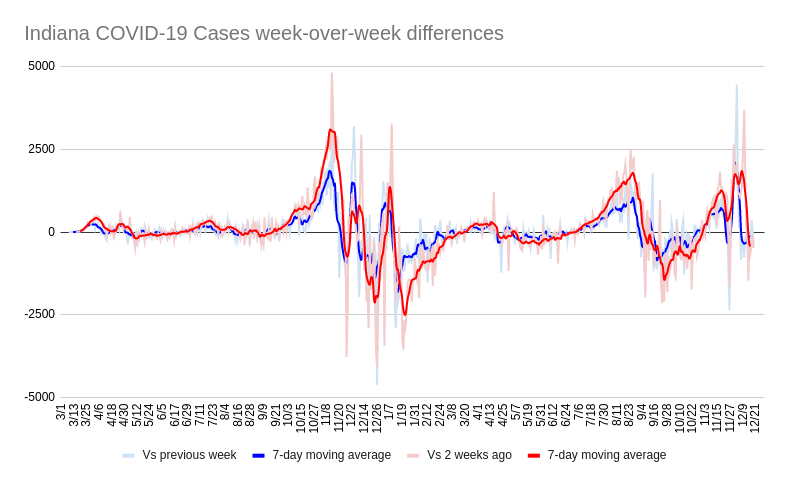
There’s some indication that we’re approaching the peak for new infections. Week-over-week and week-over-two-week changes in new cases are trending downward, as is the difference in weekly cumulative cases. While still higher than almost any other time during the pandemic, the slowing is a good sign. However, there are a few caveats:
Test availability, particularly for rapid tests, is pretty limited anecdotally
At-home tests are not included in the state’s data
Omicron has a higher percentage of asymptomatic infections (source, p1), which could plausibly mean a smaller percentage of infections are being detected.
Week-over-week (blue) and week-over-two-week (red) changes in COVID-19 cases
So we’re maybe peaking, maybe not. Some states have already peaked, which lends some credence to the “actually peaking” scenario. From what I’ve seen, case rates drop dramatically after the peak. Presumably because there’s just no one left to infect? 42.5% (and climbing!) of people reporting test data to the state are testing positive right now. At this point, there’s basically nothing we can do about it.
Our models suggest that transmission is so intense, and the wave is cresting so fast, that policy interventions such as mask mandates, increased third-dose vaccination coverage, and increased vaccination of the hesitant will have no real impact on this wave. … Given that transmission cannot be controlled, the toolkit used during previous waves of the pandemic will not work. In our models, testing strategies will not curtail the rapid Omicron wave, nor will increased mask use.
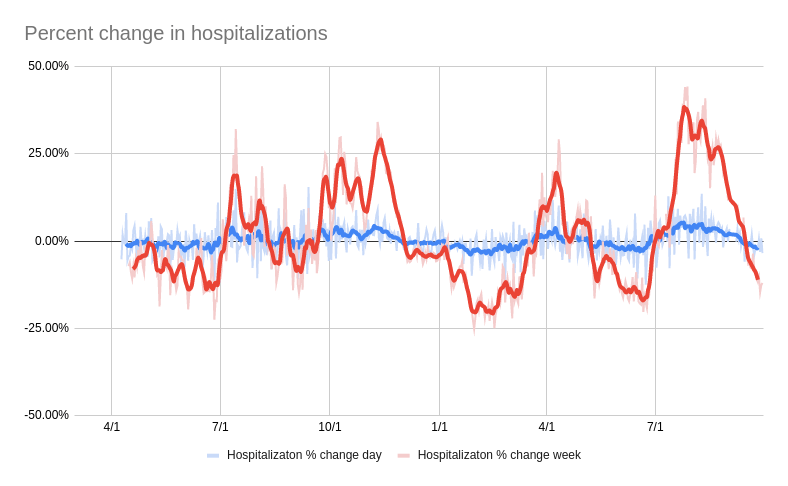
COVID-19 is overwhelming hospitals. The nine-country district that includes Lafayette has 0–3 available ICU beds most days. Statewide, we have set several new hospitalization counts in the last week. This is a little misleading: the Institute for Health Metrics and Evaluation (IHME) estimates roughly half of COVID-19 nationwide are hospitalized with COVID, not for COVID. Nonetheless, they’re still occupying beds, which are increasingly harder to come by. COVID ventilator usage remains at a higher percentage of total capacity than in last winter’s surge.
Daily (blue) and weekly (red) changes in COVID-19 hospitalizations.
What encourages me is that the increase in hospitalizations is rising more slowly than the increase in cases. This was not the case in previous waves. It suggests we’re seeing what others have reported: Omicron is individually less severe. From a public health perspective, of course, it’s still a huge problem. Don’t get in a car accident or have a heart attack for a while.
Deaths
This is where I get confused. Weekly cumulative deaths continue to decrease. Weekly cumulative deaths (the total of deaths in the last 7 days minus the total of deaths in the 7 days before that) have been decreasing since about December 20. Given that hospitalizations began to rise around Christmas, I’d expect to see an increase in the deaths by now. We’re not seeing that yet. I’m glad if that pattern holds, but it confuses me. With hospitalizations still on the rise, we’ll have to wait and see.
Daily COVID-19 deaths
I want to take a moment to note that over 30% of Indiana’s COVID-19 deaths have occurred since July 1, 2021. This represents almost 6,000 Hoosiers who didn’t have to die. The vaccines are lifesavers and anyone who claims otherwise is morally responsible for these deaths.
Looking ahead
IHME’s latest model run shows that we peaked in estimated infections earlier this week. Reported infections will peak in about 10 days. By mid-March, infections will be back down to about 1,200 per day. That’s a rate we haven’t seen since the beginning of the Delta wave in early August. Hospitalizations will peak at the beginning of February. The model predicts both all-bed and ICU usage will be nearly twice the December 2020 peak.
The near-term historical death data on IHME’s page does not match reality, so I won’t incorporate it into my dashboard or give it any credence here. I suspect it may be that the historical data is based on day-of-report, not day-of-death. However, that theory has a lot of holes.
Instead, I’ll talk about the previous run, which matched reality much better. And it turns out it’s the first model run I’ve added to my dashboard since the end of September. Oops.
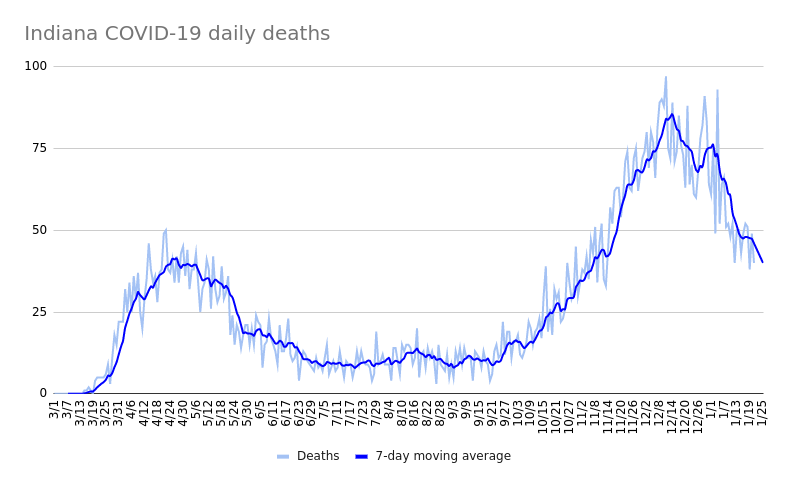
Currently, the January 8 model is under counting daily deaths by about eight per day. The model shows a minimum on the 8th, with a rise to 60 by the end of the month. This is about half of last winter’s peak day, or about the same as we were in the week before Christmas 2021.
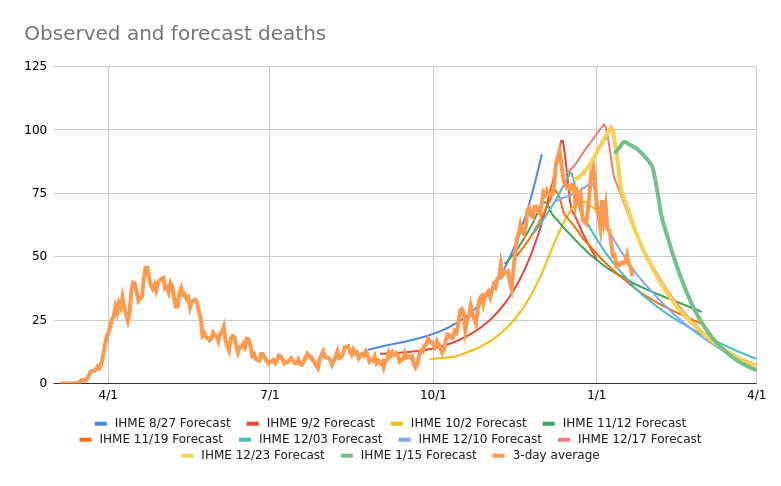
Observed and projected COVID-19 deaths.
This model run forecasts a return to single digit daily deaths the second week of March. The last time we were in single digits was August 7, 2021.
Oh hey, one of these again. I’m mostly doing this as a timestamp of sorts. Indiana identified its first case of the Omicron variant about a week and a half ago. Given the 2–3 day doubling interval seen elsewhere, Indiana could potentially see daily case records by mid-January. Even if Omicron proves to be less virulent, the increased transmissibility may result in steady or increased hospitalizations and deaths. So that’s what the future might hold. Where does the present stand?
Current state
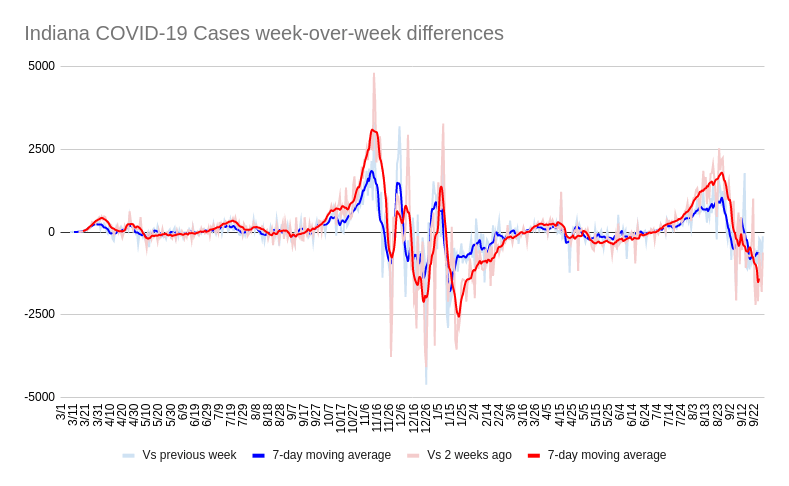
Cases have peaked after climbing since around Halloween. My “weekly cumulative cases change” (the change in the sum of the daily positive cases for the last seven days compared to the sum for the seven days prior) has been in the single negative digits for the last nine days. It was as high as 95% earlier this month. The rate of decrease is slowing a bit in the last few days, though.
Week-over-week (blue) and week-over-two-week (red) differences in COVID-19 cases
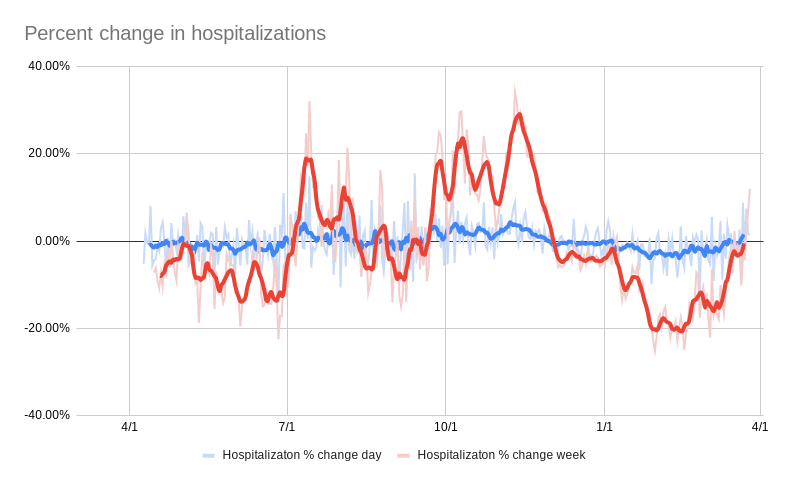
Hospitalizations have peaked as well. We spent five consecutive days above 3,000. While we’re below that number again, we’re still at a higher hospitalization rate than the peak of the Delta variant wave in late summer. Late last week, we high a pandemic low for percentage of available ICU bed capacity statewide. As I told my friend the other day, I’m not personally concerned about COVID, I’m concerned about driving.
Day-over-day (blue) and week-over-week (red) changes in hospitalizations.
It’s hard to tell if deaths are peaking or not. The numbers tend to get revised upward for longer and longer periods these days. I do know that (as of this writing), 53 people died a week ago. That’s the highest single-day death toll since early February. While the current cumulative weekly death difference shows a decline starting yesterday, I think the 15–20% numbers a few days back are probably closer to reality. Considering that hospitalization just peaked on Thursday, we’re probably a few days out from the peak in deaths.
Coming up
The Institute for Health Measurement and Evaluation hasn’t done an Indiana model run since 17 November. They’re currently trying to incorporate Omicron into the model. Looking at last winter, we’re at or slightly ahead of this time a year ago. Depending on what measure you look at, the peak last year was in roughly mid-December. With vaccines available, we should see hospitalization and death rates far below that miserable winter. On the other hand, indoor masking is nearly non-existent and the Omicron variant presents a rather significant unknown.
Indiana is the worst state for COVID safety, with low vaccination and high hospitalization. This is a failure of leadership, especially considering that most deaths since July 1 would have been prevented with better vaccination rates. Nearly 25% of Indiana’s total COVID-19 fatalities could have been avoided had right-wing politicians and media not made COVID-19 into a culture war.
As usual, I’ll keep my dashboard updated most days that the Department of Health provides data.
Well, here we are again. Indiana’s numbers have been consistently trending downward. I feel comfortable saying we’ve passed the delta peak. The “good” news is that given recent infections—plus people who have been vaccinated—winter will be less peak and more plateau. Let’s look at some graphs from my dashboard.
Cases, hospitalizations, and deaths
The rate of change in cases stopped increasing in early August. By early September, they were dropping week-over-week. With school starting and then Labor Day, there was a potential for a big increase. Thankfully, we did not see that. Even more thankfully, kids 5–11 may be able to get their first shots before October.
Week-over-week (blue) and week-over-two-week (red) differences in new COVID-19 cases
Hospitalizations have been falling steadily in the past few weeks. If the trend holds, we may be below 2,000 by Monday. That would be the first time since August 23. ICU beds and ventilator usage peaked around September 13. Interestingly, the ventilator usage percentage then was higher than during the worst part of last winter. I’m not sure if that’s due to a reduction in capacity or what.
Day-over-day (blue) and week-over-week (red) changes in hospitalizations
Deaths have also peaked. As of right now, it appears that the peak was September 15. However, the lag in reports seems to have increased, so it’s possible that date will shift forward a bit. In any case, the precipitous drop has become less precipitous. The peak daily death toll is near what we saw in spring 2020. I shudder to think how bad things would have been had the delta variant arrived pre-vaccine.
Daily COVID-19 deaths on a logarithmic scale.
The future
The Institute for Health Metrics and Evaluation (IHME) model has varied a lot in the last month or so. The September 1 model run seems to have captured the increase the best, although it had a stronger and later peak than what is apparently the case. Although the state hasn’t made any changes, I’ve observed more people wearing masks and the state has seen an increase in vaccination. The earlier models took a pessimistic view of behavior, which may explain the difference.
Policy
The state has changed to updating its dashboard at 5pm instead of noon. This is ostensibly to allow more time for quality control and to catch missing data. Cynically, I think it’s because they’d been hours late regularly and decided to lean into it. The updates have been less reliable, too.
Given that the briefings are now being done irregularly and without the governor present, I must stick with my conclusion that he has abdicated any claim of leadership. The state seems to have no desire to give a damn about COVID-19.
About a month ago, I wrote that Indiana has surrendered to COVID-19. That remains the case. As you might expect, the trends have continued in the wrong direction. Since August 9, daily deaths are up 57%, hospitalizations 85%, and cases 150%. The lone comfort is that hospitalizations aren’t rising as fast as cases and deaths are rising even less. The vaccines work, if we can only get people to take them.
Recent trends
Not only have cases been increasing since early July, but the rate of increase has increased, too. Only in the last week or so has the week-over-week new case difference started to drop.
Hospitalizations had been showing an alarmingly exponential rise. In late July, we saw the highest week-over-week since records began on April 8 of 2020. This has slowed recently, although it still rivals the increases we saw last fall.
The death rate appears to be leveling off. However, this could be due to reporting delays, so it’s a little early to feel good about it yet. Especially since COVID-19 remains the number two cause of death in Indiana in the past week.
In a Twitter thread on Friday, I used November 9, 2020 as comparison to where we are right now. That date had a comparable number of hospitalizations as we currently have and it was on the upswing. At that point, we were about three weeks away from peak hospitalization. However, the rate then was higher, so we may peak earlier. Alternatively, we may have a broader peak since we have fewer mitigations in place as we did then and—while non-zero—our vaccination rate remains infuriatingly low.
I also looked at ICU bed usage and ventilator usage. The ICU beds devoted to COVID-19 patients is about the same (27.8% of total capacity then compared to 28.4% now). Ventilator usage is higher now (10.4% compared to 8.5% then), which is a cause for concern. What’s not clear to me is if capacity is reported as physical beds and ventilators or the number that can be appropriately staffed. I suspect the state is using the physical counts, which makes me wonder what the true utilization is. Local hospitals say they’re at a breaking point, and things are likely to get worse before they get better.
Future projections
The Institute for Health Metrics and Evaluation (IHME) have increased the daily deaths in the last few model runs. However, the most recent one dialed the forecast back a bit. The bad news is that we’re tracking it pretty well so far. The good news is that their model is running high on the hospitalizations, so that may mean the death toll is over-forecast, too. We should hope this continues, because both overall hospital and ICU bed usage is forecast to enter the “extreme stress” category later this month. We did not reach that category during last winter’s surge.
It feels like there are more uncertainties now than a few months ago. The IHME model does not explicitly account for school reopenings. The note that “[t]he second Delta surge in Scotland after a peak and a decline when schools opened is potentially a warning sign on the potential for school openings to drive increases in transmission.” Additionally, while mask usage has increased, we’re only at about 25% of adults saying they mask up when they leave the house. And the percentage of Hoosiers that say they have been or probably would be vaccinated remains steady just below 60%. If either of those numbers increase significantly, things could be much less bad than expected.
What to expect
It’s clear to me that Governor Holcomb will continue to do nothing. I’m not sure what it would take at this point. In fact, his recent executive order apparently reduced quarantine requirements for schools. Someone at the state health department had a moment of clarity, which was deleted.
In the meantime, I leave you with this since-deleted health department tweet that could reasonably be taken as a subtweet of the governor. pic.twitter.com/x6LvIXb5BP
I’d really hoped to not have to write another of these. The optimism I felt at the end of March when all the numbers were on the way down and vaccination was becoming widely available has now vanished. As the so-called delta variant races through the country, all of Indiana’s numbers are heading upward again.
Recent trends
After a slow downward trend to start the summer, the last few weeks have shown an increase in COVID-19 deaths.
Daily COVID-19 deaths in Indiana on a logarithmic scale with a 7-day moving average.
This is to be expected given the increase in cases and hospitalizations. In fact, the hospitalizations have increased faster than any time since the state started keeping records in early April of 2020.
Week-over-week (blue) and week-over-two-week (red) changes in COVID-19 cases.Day-over-day (blue) and week-over-week (red) changes in COVID-19 hospitalizations.
The state had over 1,000 people in the hospital on Thursday (the latest data available) for the first time since May 4. If Friday was also above 1,000, that will mark the first time with consecutive 1,000+ days since mid-February. Hospitalizations have gone up 146% in the last month.
Indiana surrenders
The state used to update its COVID-19 dashboard daily. Then it stopped on Sundays. Now it’s just updated on weekdays. There’s no sign that the state government will do anything to require either masks or vaccination. Some local governments are re-implementing (or at least considering) mask mandates. I haven’t heard much about vaccination mandates except for at universities.
With schools starting or about to start, some districts have decided to have a mask mandate after all. (My kids school is among those, thankfully.) Others are leaving it up to individual families. Considering roughly half of K-12 students are not eligible to be vaccinated yet, this seems like a monumental policy failure. This is even more true if the delta variant is more severe in children than previous versions of the virus. At the moment, that appears to be more than a hypothetical.
It seems to me that the state has just surrendered. The governor is nowhere to be found on this, despite doing fairly well in the early days. In a recent press briefing, the state’s Health Commissioner was very diplomatic, but my interpretation of her answer to a few questions was “I wish we’d stop being dumb as a state and have some smart policy here. But my hands are tied without support from the Governor or the General Assembly.”
Projections
Unsurprisingly, the Institute for Health Metrics and Evaluation (IHME) forecast model continues the trends for the next few months. The latest model run projects a peak in daily deaths in the low-30s in mid-October. This is the “reference” scenario. The “worse” scenario peaks around 55. The worse scenario isn’t out of the question with an increase in in-person school and work. So much will depend on whether or not people wear masks and get vaccinated.
Observed and IHME-forecasted daily COVID-19 deaths
The good news is that if the reference scenario verifies, it will be lower than the previous two major peaks in deaths. The bad news is that a lot of people will still die unnecessarily.
As you may notice in the graph above, I had a long gap where I wasn’t adding new IHME model runs. Since it’s now clear that we won’t be done with COVID-19 any time soon, I’ll probably go back in the next few days and fill in that gap a bit. This way we can get a better sense of how the early summer model runs did.
Dashboard changes
I’ve made a few changes to my dashboard this weekend. First, I’ve changed the moving averages to be centered instead of trailing on all of the graphs. This keeps the last few days of data from distorting the trend.
In addition, I’ve added columns for a percentage change in deaths and cases week-over-week. The idea here is to produce a graph that shows the trends in cases, hospitalizations, and deaths. This would allow the viewer to see the relationship and delay between the three measures. To make it less noisy, it’s actually a comparison in the cumulative data over a seven-day window. That’s not necessary in the hospitalization data because that census is conducted every day. But cases are subject to a lot of variation throughout the week, and even the same-day-last-week comparisons seemed all over the place. Deaths are a relatively small number so small changes can be a big percentage.
I’m not going to bother putting the resulting graph in this post. It’s still a lot of spaghetti and not particularly informative. Later on I might play around with doing a second derivative. Perhaps showing how the rate of change is changing will be easier to understand.
Future dashboard changes
I’m beginning to hit annoyances with Google Sheets. In particular, inserting a new column (unless it’s at the far right of the data) means I have to re-adjust all of my graphs. I’ve been toying with the idea of using the Python Pandas package to do analysis and graphing. Then I could publish the graphs to a static website. It would also allow me to do a little more analysis, like listing the top 10 days for a particular stat or trend.
Another option I’ve been thinking about is splitting the sheet into multiple tabs. I could have a tab for the observations, another for models, etc. I’m not sure how well Google Sheets would like that, but it’s something to toy around with. It doesn’t seem like as much work as completely rebuilding it in a new system, but it’s also not trivial.
Given my lack of free time and the amount of effort that either of these options would require, I wouldn’t expect to see either happen for a while. However, it seems like I’ll be maintaining the dashboard for quite a while, so who knows?
I haven’t written an update in nearly two full months. This is only slightly due to laziness. Mostly, it’s because the state’s numbers have been unremarkable. I mean that in a good way. We’ve consistently trended downward in infections (and positivity), hospitalizations, and deaths. However, we seem to have reached the floor and I’m concerned that the early indications suggest an increase. As usual, I am updating my dashboard most days.
Changes in trends
Five days in the past week (including the three most recent) had a daily increase in the hospitalization count. Two days had a 7% or greater daily increase. These are some of the largest increases on record. The hospitalization count is 12% higher than a week ago. Meanwhile, we’ve had a full week of week-over-week increases in positive cases. Only one day in the last 10 showed a week-over-week decline.
Daily and week-over-week changes in COVID-19 hospitalizations in Indiana.
Deaths continue to slowly trend downward, but if the increase in hospitalization holds, expect an uptick in deaths soon. After under-predicting the deaths during the surge in the fall, the Institute for Health Metrics and Evaluation (IHME) models are consistently over-predicting deaths. However, it does not appear that the most recent model run takes the end of the mask mandate (see “Changes in policy”), so it will be interesting to see how they fare in a month.
Observed and forecasted COVID-19 deaths in Indiana.
Changes in behavior
The IHME’s latest policy brief says mobility in Indiana is 8% below the pre-pandemic baseline. This is a big jump from the 20–25% of just a month or so ago. Meanwhile, mask usage has fallen slightly to 72%. Given these, it’s not hard to see why the numbers are picking back up again. These are both trends specifically called out as factoring into the “worst-case scenario.” (Note that the “reference scenario”—or most likely scenario—is what I plot on my dashboard.)
Changes in policy
Governor Holcomb announced earlier this week that the mask mandate will be gone on April 6. This is bad policy. While all Hoosiers 16+ will be eligible for vaccination beginning on March 31, the earliest a newly-eligible person will be fully vaccinated is April 14. And that assumes that the person can get the vaccine that day and that they receive the one-dose Johnson & Johnson vaccine. Recall that the CDC says people reach full vaccination two weeks after receiving the last shot.
In other words, in the impossibly-best case scenario, the mask mandate ends a week before the state’s (adult) population is fully vaccinated. The more likely case is that we don’t hit the 70% threshold for weeks, perhaps months. Holcomb says “Hoosiers know the science” and will continue to wear masks and follow distancing guidelines once the mandate becomes an advisory. I wonder what Hoosiers the governor has been talking to. Considering how many crowded restaurant parking lots and improperly-worn masks I’ve seen in the past week, I don’t believe him.
This is infuriating, because a mask mandate is essentially free. This is particularly true given how little effort the state put in to enforcing it. Ending the mandate early sends the wrong message. We can only hope that vaccinations outpace the virus. We deserve better than this.
The missing deaths stretch as far back as early April, but the bulk came in November through January. This is also when the overall death rate was the highest. On the whole, approximately 15% of COVID-19 deaths were not included on the state’s dashboard prior to February 4. But on 48 days, the missing deaths exceeded 20%. On December 18, 31 deaths (29% of the total) were missing. Instead of having a peak death count of 97, we’ve instead exceeded 100 deaths on several days with a peak of 118.
COVID-19 deaths per day before and after the “missing” deaths were included
I wrote in the last update that I thought deaths were missing, particularly given the abrupt drop in December. It turns out that I was more right than I could have imagined. “I’m not trying to sound like a conspiracy theorist,” I wrote. “I don’t think there was any malfeasance.” I’m trying very hard to continue believing that.
At the very least, this represents appalling incompetence. This isn’t just a problem for making graphs. The death toll of this pandemic is serious. Losing 15% of the deaths is not only disrespectful to the dead and their families, but it robs decision-makers of reliable data. What decisions would have been made differently if we knew the true death toll.
Of course, we may never be sure of the true death toll, particularly early in the pandemic. At the time, testing was scarce. I’ve heard anecdotes from several reliable friends of loved ones not getting testing after death. We can compare 2020’s overall death to previous years, but that will not be definitive.
The future
The good news is that the overall numbers continue to trend in the right direction. Yesterday, hospitalizations were below 1500 for the first time since October 20. Deaths, new cases, hospitalization, and positivity all continue to drop. Mask usage is up and mobility remains 20% below the baseline, per the Institute of Health Metrics and Evaluation (IHME). Perversely, the corrected death totals represent a positive of sorts: the recent model runs have proven more accurate than it appeared.
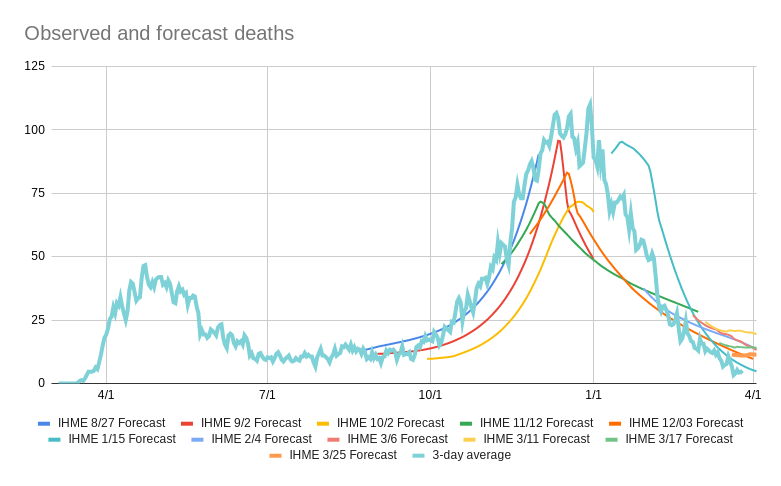
Observed and forecast COVID-19 deaths in Indiana by day
As best I can tell, IHME’s most recent model run did not include the adjusted death totals, so it will be interesting to see how much changes in the next update. The observed death trend is dropping at a faster rate than the models would suggest, but that may flatten a bit over the coming days. Still, the trends are encouraging.
Causes for concern
But all is not well. Although IHME’s latest model run does not show an increase in deaths through the end of May, they say some states will see that. But even more worrying, it appears some of the new variants may lead to reinfection in people who already have immunity.
The Novavax Phase III trial in South Africa placebo arm found that prior infection provided no protection from variant B.1.351. The implication of this finding is that herd immunity is only variant-specific; if this finding is confirmed in the Johnson & Johnson placebo arm data, our worse scenario is likely too optimistic.
IHME COVID-19 Policy Brief for the United States, 3 February 2021
With the next update, IHME will incorporate cross-variant reinfection into the model. I’ll continue to update my dashboard with the new model runs as they’re available.
It has been over a month since I’ve written one of these. Part of that was because I had other things to do. Part of that was a lack of updated projections from the Institute of Health Metrics and Evaluation (IHME). And part of it was that I didn’t believe the state’s numbers. I kept updating my dashboard regularly, but it seemed like something was missing: deaths.
I’m not trying to sound like a conspiracy theorist. I don’t think there was any malfeasance. But the data doesn’t always come in right away. I’m not sure what the reporting chain is like, but there are probably a few steps before it gets to the Indiana State Department of Health. The latency increased in December, so I figured any day the numbers would catch up. The drop from 90 deaths a day to 45 was so rapid that it couldn’t be real.
Daily COVID-19 deaths in Indiana
Well I’ve been waiting for weeks and the trend has held. I’m not sure what happened, but about the second week of December the COVID deaths and hospitalizations plummeted. This is a very good thing, even if the explanation isn’t obvious.
The experts at the IHME model run from November 23 just about nailed it in retrospect. Subsequent runs seemed to over correct based on the state’s run of higher-than-forecast fatalities. The model run published yesterday comes closer to reality, but it is still running a bit hot.
Observed and IHME forecasted COVID-19 deaths in Indiana from March 1, 2020 to April 1, 2021.
The good news is that IHME’s U.S. policy briefing says the peak is behind us (although the model does not account for the recently-discovered strains that are more transmissible).The briefing isn’t all good news, though. Looking forward to teh end of the year, IHME has this to say:
We do not expect the US to reach a level of herd immunity that would prevent a third wave next winter. This is because a quarter of Americans state they will not take the vaccine and a further quarter state they are unsure. In addition, we do not have clear evidence on how much vaccination stops transmission as opposed to preventing severe disease and death. Scale-up of vaccination does mean, however, that the number of deaths in a third wave, if it occurs, would be greatly reduced.
It’s been a while since I’ve written one of these posts. Partly due to being busy, partly due to being burnt out, partly due to “how can I write ‘yep, everything is still terrible’ each week without repeating myself?”. And honestly, it’s been weird to realize that even though the situation in Indiana is worse than it has been at any point in the pandemic, it doesn’t feel that much worse to me. I realize how incredibly fortunate I am to be able to say that.
Since my last update, vaccines have received emergency use authorization and are in the early stages of being distributed. It will be months before we have widespread vaccination, but at least there’s hope. Of all the jobs I’m glad I don’t have, “decider of who gets vaccinated first” is one that I’m most glad about.
I haven’t made any major structural changes to my dashboard. The main difference is some tweaks to the model forecast graph to make it easier to read (I hope).
Deaths
Anyway, the Institutes for Health Metrics and Evaluation (IHME) model runs keep nudging the total fatalities up. This is a reflection of how rapidly deaths have risen in the last month. The latest model run brings us to a peak of ~102 daily deaths in Indiana on January 5. It seems to track the general trend in the reported data pretty well, if you ignore the last few days. As the number of deaths has risen, it seems that the counts now frequently go up significantly for two or three days after, instead of just the day after. If anything, the model may be too optimistic.
Observed and forecast death counts for Indiana.
Hospitalizations
There is good news, though. While October and November featured a rapid rise in hospitalizations, with new records set almost every day, that trend has largely reversed. Even with the Thanksgiving holiday, we’re starting to see declines in hospitalizations most days. If that holds for a few more days, we might get below the 3,000 mark for the first time in over a month. As it stands, yesterday’s hospital census had about 13% fewer patients than the peak on November 30.
Day-over-day (blue) and week-over-week (red) changes in Indiana COVID hospitalizations.
Despite the downward trend in hospitalizations, the available ICU bed capacity continues to hold steady near 20%. Interestingly, non-COVID cases are driving this, according to the state’s dashboard. COVID ICU bed and ventilator usage, while still much higher than over the summer, is trending downward.
What I’m watching
In the coming week, I’ll be watching to see if the lower death tolls the last few days hold. It seems unlikely that there’s such a sudden drop in deaths. Tuesday and Wednesday of this week had a bunch of backdated deaths added to the report. I would expect the same next week.
With the coming Christmas and New Year holidays, the testing and new case data is about to get unreliable. But I’m interested to see if the apparent uptick in positivity holds or if we return to the general downward trend of the last two weeks. As of today’s update, we’re at 12.4% for all tests (24.4% individuals) statewide. This is very bad.